2. 封装一个基础的耗时统计工具类
在日常的工作中,对某一段代码的执行耗时进行记录,属于相对常见的诉求,实现起来也很简单,不就是开始前记录一下当前时间戳,执行结束之后再记录一下当前时间戳,两者相减就可以得到我们想要的结果了
1. 时间戳差值法
这里主要借助的就是 System.currentTimeMillis() 来获取当前的时间戳(毫秒)
1.1 基本实现
先来看一下基本的使用姿势
// com.github.liuyueyi.hhui.trace.test.step.Step1#testCost
long start = System.currentTimeMillis();
// ... 这里省略掉需要计算耗时的业务逻辑
long end = System.currentTimeMillis();
System.out.println("cost: " + (end - start) + "ms");
上面这种写法比较简单直接,唯一的问题就是会有较多的重复冗余代码,特别是再一个执行链路中,存在较多的地方需要输出耗时时,就会发现代码块中,会出现大量的上面的代码块
有没有什么办法可以提炼一下呢?
- 通过函数方法来实现
1.2 公用方法
针对上面的写法,我们抽出一个耗时统计的公用方法,如下
// com.github.liuyueyi.hhui.trace.test.step.Step1#runWithTime
private void runWithTime(Runnable run) {
    long start = System.currentTimeMillis();
    try {
        run.run();
    } finally {
        long end = System.currentTimeMillis();
        System.out.println("cost: " + (end - start) + "ms");
    }
}
当执行一个代码块不需要关注返回结果时,就可以通过下面这种方式进行耗时输出
private static Random random = new Random();

/**
 * 随机睡眠一段时间
 *
 * @param max
 */
private static void randSleep(int max) {
    int sleepMillSecond = random.nextInt(max);
    try {
        System.out.println("随机休眠 " + sleepMillSecond + "ms");
        Thread.sleep(sleepMillSecond);
    } catch (InterruptedException e) {
        throw new RuntimeException(e);
    }
}

@Test
public void testCost2() {
    runWithTime(() -> {
        randSleep(100);
    });
}
执行以下上面的 testCost2 ,会得到如下的执行耗时输出
随机休眠 43ms
cost: 45ms
上面的公用方法适用于没有返回结果的耗时打印,但是现实中,当然还存在需要获取返回的场景,这个时候我们可以再封装一个公共方法,适用于有返回结果的场景
private <T> T supplyWithTime(Supplier<T> sup) {
    long start = System.currentTimeMillis();
    try {
        return sup.get();
    } finally {
        long end = System.currentTimeMillis();
        System.out.println("cost: " + (end - start) + "ms");
    }
}
给出一个具体的使用demo
// com.github.liuyueyi.hhui.trace.test.step.Step1#testCost3
@Test
public void testCost3() {
    String ans = supplyWithTime(() -> {
        randSleep(100);
        return "hello";
    });
    System.out.println("返回结果是:" + ans);
}
下面是执行的返回结果示例
随机休眠 22ms
cost: 25ms
返回结果是:hello
1.3 实现小结
上面基于时间戳封装了一个简单的耗时打印公共方法,我们整合一下关键的实现,提炼一个通用工具类如下
public class CostUtil {
    public static void cost(Runnable run) {
        long start = System.currentTimeMillis();
        try {
            run.run();
        } finally {
            long end = System.currentTimeMillis();
            System.out.println("cost: " + (end - start) + "ms");
        }
    }

    public static <T> T cost(Supplier<T> sup) {
        long start = System.currentTimeMillis();
        try {
            return sup.get();
        } finally {
            long end = System.currentTimeMillis();
            System.out.println("cost: " + (end - start) + "ms");
        }
    }
}
对应的使用姿势也比较简单,根据是否有返回结果,可以区分为下面两种
// 无返回结果
CostUtil.cost(() -> xxx);

// 有返回结果
Object ans = CostUtil.cost(() -> xxx);
从结果来看,这个工具类已经能满足基本诉求了,那么到此为止么?再看一下这个工具类,会有什么问题么?
从使用侧的角度来看,这个工具类还有两个不便
- 代码侵入性强,需要主动再业务代码中进行集成
- 输出结果分散,对于链路较长的业务,具体是哪一块业务逻辑耗时较久不太直观
2. StopWatch工具类
Spring本身提供了一个耗时统计的工具类StopWatch,当然也有很多的组件库(如Hutool)提供了类似的工具类,那么它主要是为了解决什么问题呢?
2.1 使用体验
接下来我们通过实际的使用,来体验一下StopWatch的效果表现
// com.github.liuyueyi.hhui.trace.test.step.Step2#testCost
@Test
public void testCost() {
    StopWatch stopWatch = new StopWatch("测试耗时");
    stopWatch.start("task1");
    randSleep(100);
    stopWatch.stop();

    stopWatch.start("task2");
    randSleep(30);
    stopWatch.stop();

    System.out.println(stopWatch.prettyPrint());
}
输出如下
随机休眠 28ms
随机休眠 3ms
StopWatch '测试耗时': running time = 42711600 ns
---------------------------------------------
ns         %     Task name
---------------------------------------------
038508000  090%  task1
004203600  010%  task2
从上面的输出结果,可以直观看到每个任务的耗时,对整体耗时的占用百分比,基于此可以更容易找到性能瓶颈点,这里也可以回答上一节的疑问,主要解决的就是上面提到的第二个缺陷:输出比较分散的问题
2.2 使用封装
同样的,我们也希望将上面的使用姿势做一个封装,尽量减少冗余代码对业务代码的侵入
 public class StopWatchWrapper implements Closeable {
    private StopWatch stopWatch;

    public static StopWatchWrapper instance(String task) {
        StopWatchWrapper wrapper = new StopWatchWrapper();
        wrapper.stopWatch = new StopWatch(task);
        return wrapper;
    }

    public void cost(Runnable run, String task) {
        stopWatch.start(task);
        try {
            run.run();
        } finally {
            stopWatch.stop();
        }
    }

    public <T> T cost(Supplier<T> sup, String task) {
        stopWatch.start(task);
        try {
            return sup.get();
        } finally {
            stopWatch.stop();
        }
    }

    @Override
    public void close() {
        System.out.println(stopWatch.prettyPrint());
    }
}
上面的工具类中,我们借助Closeable + try 来实现自动的耗时输出
接下来再看一下使用姿势
@Test
public void testCost2() {
    try (StopWatchWrapper wrapper = StopWatchWrapper.instance("耗时统计")) {
        randSleep(300);

        wrapper.cost(() -> randSleep(100), "task1");

        String ans = wrapper.cost(() -> {
            randSleep(30);
            return "ok";
        }, "task2");
        System.out.println("task2 返回:" + ans);

        wrapper.cost(() -> randSleep(50), "task3");

        randSleep(300);
    }
}
输出示例
随机休眠 277ms
随机休眠 83ms
随机休眠 11ms
task2 返回:ok
随机休眠 25ms
随机休眠 139ms
StopWatch '耗时统计': running time = 122743700 ns
---------------------------------------------
ns         %     Task name
---------------------------------------------
083464300  068%  task1
011454800  009%  task2
027824600  023%  task3
使用工具类,整体上对业务代码的可阅读性上,相比较于之前会更优雅一点; 那么这个StopWatchWrapper的工具类是否就已经可以满足我们的诉求了呢?
2.3 StopWatch特性小结
仔细看一下上面的耗时打印,StopWatch 输出的耗时,实际上是从首次调用 stopWatch.start 开始计算耗时,到最后一个 stopWatch.stop 调用作为结束
即上面的测试代码中,try语句中的第一个randSleep(300); 和最后一个 randSleep(300); 的耗时,实际上是不包含在最终的耗时输出结果中的,这里就有一点反直觉了
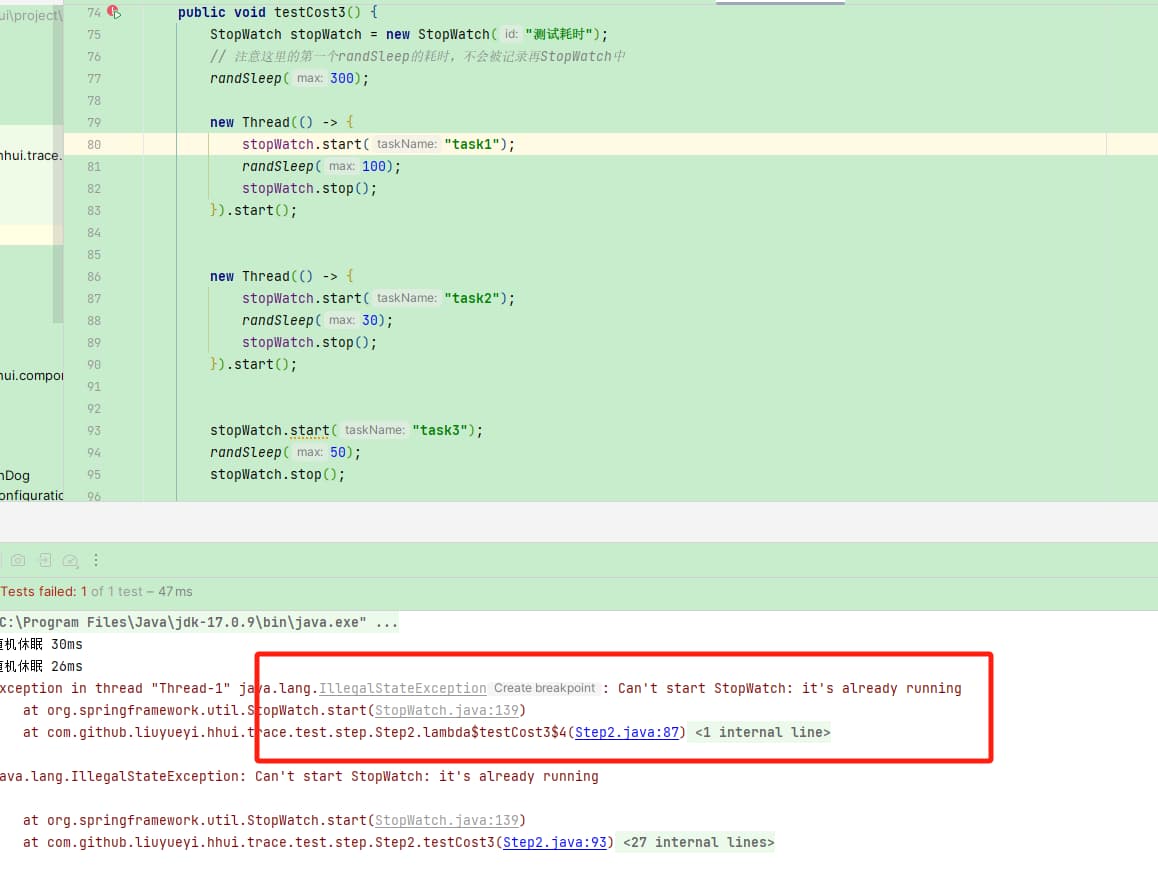
此外,有看过StopWatch源码的小伙伴可以知道,它是线程不安全的,即在多线程场景下,即容易出错
3. 小结
我们这里主要封装了两个工具类,主要解决的是使用层面的问题
- CostUtil
适用于单一代码块的耗时输出,借助 System.currentTimeMillis 获取当前时间戳,通过代码块执行前后的时间差来输出耗时情况
封装的工具类主要借助函数方法来简化使用方式,它本身的缺点有下面几点
- 侵入性强,需要主动埋点记录耗时
- 对于复杂的业务链路下,存在多个任务耗时统计时,输出结果离散不直观
- StopWatchWrapper
适用于某一业务链路,多个任务耗时打印输出场景,借助StopWatch来实现耗时分布统计
这里主要借助函数方法 + try/closeable来简化使用方式, 它解决了CostUtil的输出离散问题,单依然存在下面几个缺点
- 侵入性强,需要主动埋点记录耗时
- 并发场景下容易出现异常
既然现有的工具方法不够完美,那就自己撸一个,目标是
- 侵入性小
- 支持并发场景的耗时记录